GIFT City Funds
The ratio is a past score, not a promise. Sharpe ratio in mutual funds measures excess return per unit of volatility.
Quick Answer Box
Sharpe ratio = (Fund return − risk-free rate) ÷ standard deviation of returns. Higher is better risk-adjusted performance over the period measured. Compare only inside the same category and the same time window. There is no universal “good” number. A higher past ratio does not guarantee better future performance. Platforms such as Value Research show it. There is no official highest-Sharpe ranking.
What the Sharpe Ratio Is and When It Is Used
It is a risk-adjusted return measure. The formula is:
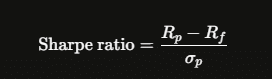
- RpR_pRp is the fund’s return over the period (often annualised).
- RfR_fRf is the risk-free rate. In Indian mutual-fund work this is commonly the yield on 91-day Government of India Treasury bills.
- σp\sigma_pσp is the standard deviation of the fund’s returns, a measure of total volatility.
The ratio of 0.8 indicates that the fund earned an excess return of 0.8 for each unit of volatility. More is better, more excess return for unit of ups and downs. If the ratio is negative, the fund underperformed the risk-free rate for that time period .
When is sharpe ratio in mutual funds used?
It’s used when you want to know if a fund’s returns made up for the volatility it took on, not just if the absolute return was high. It is most useful for comparing two or more funds which belong to same category under SEBI for same period of time. Comparing a small-cap fund with a liquid fund or a three-year number with a ten-year number is not very useful.
It’s often calculated by analysts and platforms on trailing three-year monthly returns. The exact risk free rate and the exact window may vary slightly between data vendors, so small differences in the published number are common.
What Counts as a Good Sharpe Ratio
Good sharpe ratio in mutual fund has no single answer.
- better to have a positive ratio than a negative ratio.
- Within a category, a fund that is well above the category average has delivered better risk-adjusted returns over that period.
- Some commentators define a ratio greater than 1 as “efficient.” This is a rule of thumb, not a SEBI norm and not a safety certificate. In India, equity categories typically have average Sharpes well below 1 over ordinary three-year windows, as volatility is high relative to the excess return over T-bills.
- Debt and arbitrage funds have a different typical range because of their lower volatility.
Always look at the period and the category average. 0.7 in top quartile mid-caps might be more informative than 1.1 in low-volatility or in another decade.
Platforms and the “Highest” Search
How to find mutual funds with the highest Sharpe ratio in India? Which mutual fund platforms provide Sharpe ratio data for their schemes?
Value Research, Morningstar India and a number of broker research screens publish Sharpe ratios (along with Sortino, alpha and standard deviation, usually). Within a category, you can sort or filter. AMFI releases returns and other data of schemes but does not have an official Sharpe ranking.
There is no regulator-approved list of “top Sharpe” funds. Such a list is a snapshot of a provider’s historic data. “It changes when the window rolls forward. Using it as the only selection tool ignores portfolio fit, cost, AUM, mandate drift and the simple fact that past risk-adjusted returns do not predict future risk-adjusted returns.
Does a higher Sharpe ratio guarantee better mutual fund performance?
No. It tells you what happened.” Changes in markets, interest rates, fund-manager changes, style drift and a different volatility regime can cause the ratio (or absolute returns) to be lower in the next period. A fund can have a high Sharpe because it took unusually low volatility in a rising market, then lag when market regime changes. Standard deviation does not fully describe concentration, liquidity and credit risk.
Related Measures
Sortino ratio uses downside deviation instead of total standard deviation so it only penalizes harmful volatility. Treynor used beta rather than standard deviation. The information ratio is the ratio of excess return over a benchmark to tracking error. Sharpe is still the most commonly presented single risk-adjusted number. None of them is a full verdict.
Financial & Technical Data Matrix – Reading a Sharpe Number
| Item | What it means |
| Formula | (Return − Rf) / Std dev |
| Higher number | Better risk-adjusted result in that window |
| Compare with | Same category, same period |
| “Above 1” | Rule of thumb only, not a SEBI pass mark |
| Guarantee | None for the future |
| Official ranking | None |
Risk Analysis: Eleven Sharpe-Ratio Errors
- Treating the highest Sharpe as the best fund to buy.
- Comparing across categories.
- Ignoring the time window.
- Assuming above 1 means “safe.”
- Using one provider’s number without checking the category average.
- Forgetting that a manager change can reset the relevance of the past ratio.
- Looking only at Sharpe and ignoring expense ratio and exit load.
- Expecting the same ratio in a high-volatility year.
- Negative Sharpe means “avoid forever” rather than “this window was poor.”
- NRIs assuming the Indian T-bill risk-free rate matches their home-currency risk-free rate without adjustment.
- Building an entire portfolio from a single sorted Sharpe list.
Generic Advice vs. Strategic Thinking Matrix
| Decision Point | Generic Advice | Strategic Thinking |
| Selection | “Highest Sharpe” | Above category average, same window, plus other factors |
| Good number | “Above 1” | Relative to category and period |
| Platforms | “Any site” | Value Research / Morningstar for the figure; SID for the mandate |
| Future | “High Sharpe will continue” | Past description only |
| Use | “The only metric” | One risk-adjusted lens among several |
Strategic thinking sorts inside the category after the category has already been chosen for the goal and horizon.
Closing Perspective
The Sharpe ratio shows the amount of excess return a mutual fund provided per unit of volatility during a past period. Higher is better on that metric, same category and window. There is no good number and there is no official highest-sharpe list. The platforms publish the number. A better future performance does not mean a higher past ratio.
This is general information, not a fund recommendation or a ranking.
People Also Ask
What is the Sharpe ratio in a mutual fund?
(Fund return minus risk-free rate) divided by the standard deviation of the fund’s returns. It measures excess return per unit of volatility.
When is it used?
To compare risk-adjusted performance of funds in the same category over the same period.
What is a good Sharpe ratio?
There is no fixed number. Compare with the category average for the same window. Above 1 is only a rule of thumb.
How do I find high-Sharpe funds in India?
Sort inside a category on Value Research or Morningstar. There is no official ranking.
Which platforms show it?
Value Research, Morningstar and some broker screens. AMFI does not publish an official Sharpe league table.
Does a higher Sharpe guarantee better performance?
No. It describes the past. It does not predict the future.
What risk-free rate is used in India?
Commonly the 91-day Treasury bill yield.